Module 5 Project 2
Q1)
Investigate the
metadata and complete this table:
| Layer | Data Type | Publication Information: Who Created the Data? | Time Period Data is Relevant | Spatial Horizontal Coordinate System | Attribut Values |
| dschools | Polygon | Tele Atlas North America, Inc., ESRI |
2005 | GCS_North_American_1983 | Name |
| places | Point | Tele Atlas North America, Inc., ESRI |
2006 | GCS_North_American_1983 | Demographic Data |
| ttracts | Polygon | Tele Atlas North America, Inc., ESRI |
2005 | GCS_North_American_1984 | Census Data |
I would like to establish how I created the age layer. I took the age groups 18-21 and age 22-29 and combined them into a column called both. This is different from the book but helps me keep it straight in my mind. The total of both was 221,435. The total population was 1,077,534. So I created a new column called percent. Percent was filled by field calculator with the following calculation: both divided by 221,435 (total of both). I believe this to be the percent of 18-29 year olds in that particular census tract.
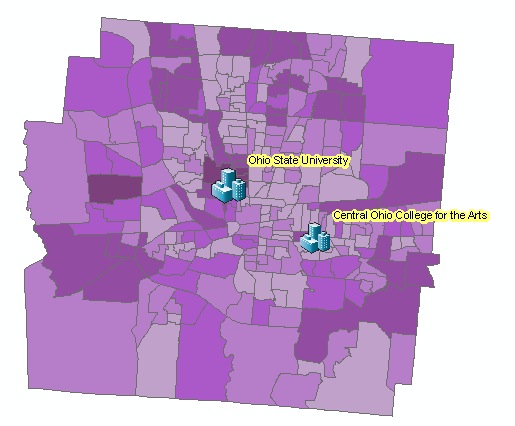
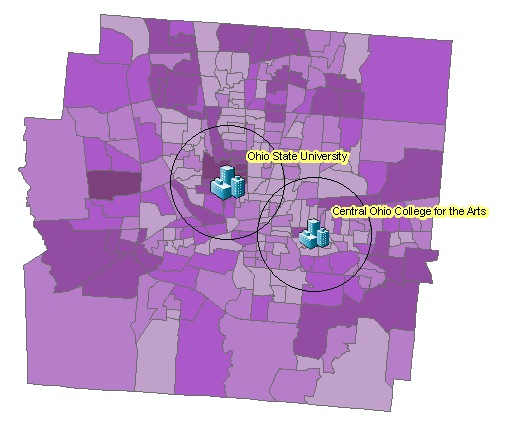
Q2) Discuss the two weighted overlays.