Module 2 Project 1
Q1)
What geographic
area are you studying?
Cook County, city of Chicago, Illinois.
Q2) What is the decision you need to make?
How to spatially display ethnic and economic diversity provide decision support.
Q3) What information would help you make the decision?
Existing ethnic and economic diversification. Historical ethnic and economic diversification.
Q4) Who are the key stakeholders for this issue? (This step is important. You need to know the audience for your analysis to help decide how to present your results.)
The local Universities Social Science Department. Actually the whole community can be effected by decisions made using this teams decision support data and analysis.
Q5) Investigate the metadata and complete this table:
Q6) What information in tracts_00 and tracts_90 can be used to show possible residential patterns of African-Americans, Hispanics, and Caucasians?
Black, White, and Hispanic population values related to that particular geographical area. How those values have changed in the ten year period.


Q7) Is there information in tracts_00 that can be used to display median house value?
No. That will be imported later from Factfinders.com.
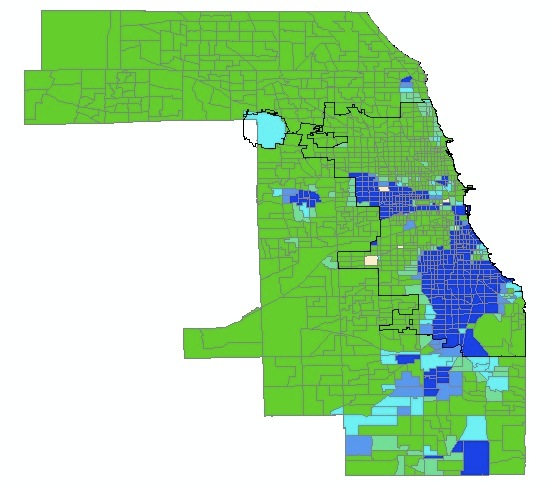
Q8) Describe the spatial distribution of population in Cook County.

Q9) Why should you normalize the data?

Normalizing data using ArcView's Legend Editor is a quick way to design ratio maps. Census data for a range of geographic areas (tracts, counties, states) provides a rich source of these mapping opportunities. This document is a guide to the concept of normalizing with ArcView using census data for examples. It offers background on some key data concepts, possible pitfalls, and suggestions on many "normalizing data pairs." GIS: Normalizing Census Data in ArcView
Q10) How does the normalized data differ from the original data?
Non-Normalized

Normalized

Q11) Describe the distribution of the African-American population and how it has changed between 1990 and 2000.

Q12) Describe the distribution of the Hispanic population and how it has changed between 1990 and 2000.
Q13) Describe the distribution of the Caucasian population and how it has changed between 1990 and 2000.

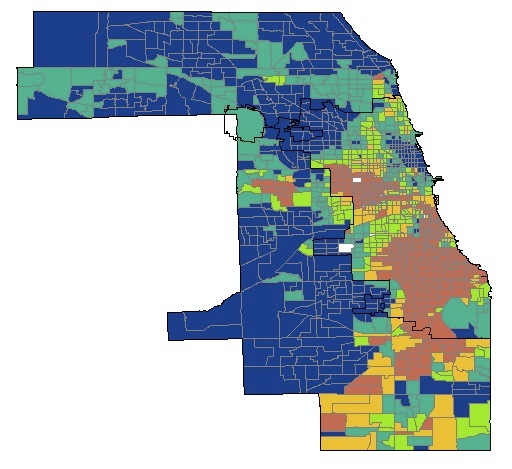
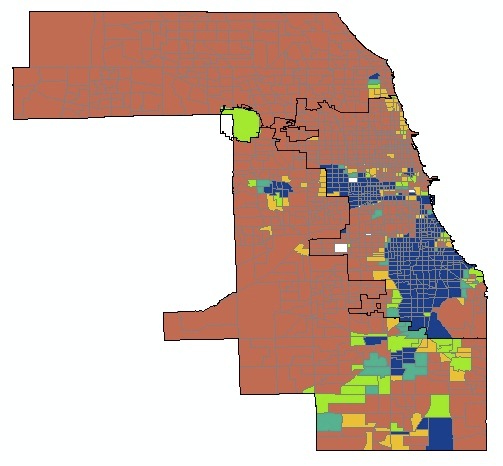
Q14) Where are there clusters of high and low diversity?
The map below show many different areas of high and low ethnic diverse areas. But there does not seem to be very much clustering.
Q15) What does low diversity mean?
Not a mix of a lot of different ethnicities.
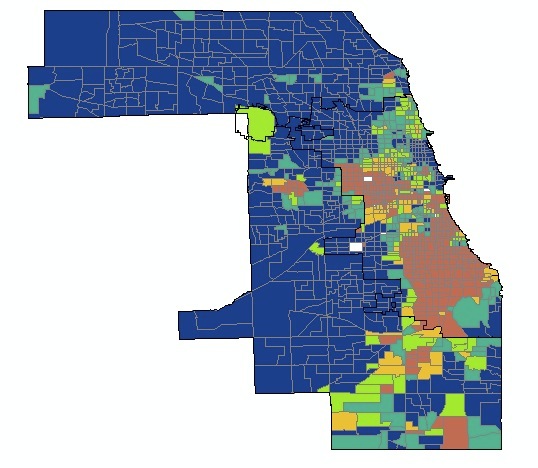
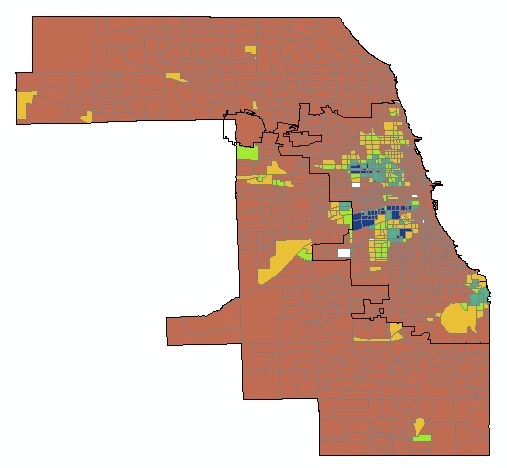
Q16) Where are there clusters of high and low diversity?
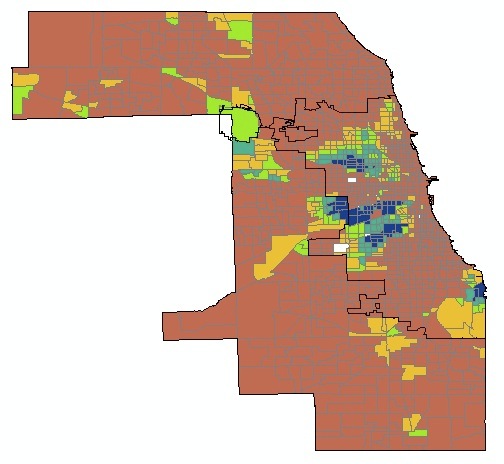
In 1990 there seems to greater diversity towards the downtown urban area of the city of Chicago. In 2000 the diversity is spread more evenly.
Q17) Describe how the diversity index has changed from 1990 to 2000.
1990
2000
Q18) Closely investigate Cook County by zooming in. What do you observe about the diversity of the census tracts?
As I zoom in I notice that the census tracts begin to looked clustered.
Q19) What does looking at the data in 3D reveal?
 This is a test
Q20) What does the median value represent?
This represents the median or average value of the homes. Total value of homes divided by the number of homes.
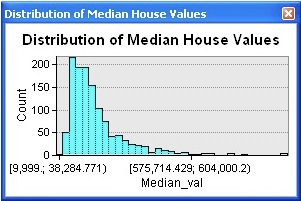
Q21) What is the lowest median_val?
$9999 (see illustration below)
Q22) What is the highest median_val?
$38,284,771
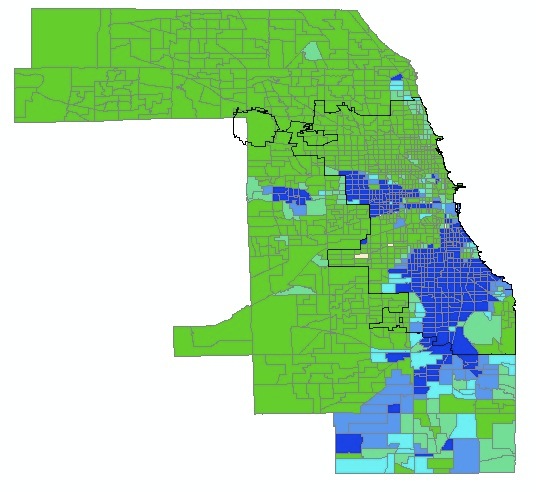
Q23) Describe the spatial distribution of house values in Cook County.
 This is a test.
Q24) What does Count on y-axis represent?
Number of homes.
Q25) What does the median_val on the x-axis represent?
Median value of homes.
Q26) Explain the patterns you see.
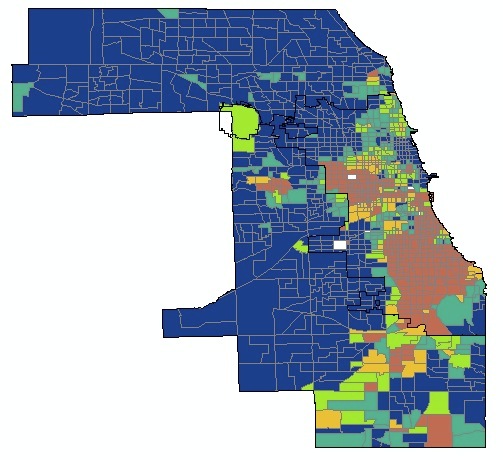
Dark blue expensive homes with little ethnic diversity. This is highly contrasted by the raised red portions in southern Cook county, which reflect greater diversity and lower home values.
Q27) Explain the double variable map.
As the legend reveals the color areas are the home values. The raised areas (raised by 3D) represent diversity. The high areas representing greater diversity.
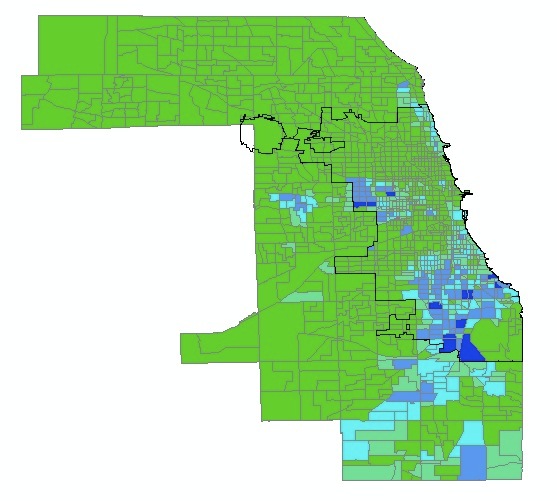
Q28) Describe the relationship between median house value and the concentrations of different ethnic/racial groups.
 This is the same map as 2000 above. I'm
including it
because it was on
one of many alternative attempts I made. This particular module was
very difficult for the program to handle as it crashed and posed
various technical problems. This adversity was painful, but
educational.
This is the same map as 2000 above. I'm
including it
because it was on
one of many alternative attempts I made. This particular module was
very difficult for the program to handle as it crashed and posed
various technical problems. This adversity was painful, but
educational.
FYI: I did all modules at least three times, but this module set the record at eight times. It seems by it nature that GIS calls for careful and accurate organizational skills. I believe because of their design principals it is taken even further when your trying to redo projects in the ESRI products. Maybe it is frustration or naiveness but I believe ESRI products are poorly designed and poorly programed.
Cook County, city of Chicago, Illinois.
Q2) What is the decision you need to make?
How to spatially display ethnic and economic diversity provide decision support.
Q3) What information would help you make the decision?
Existing ethnic and economic diversification. Historical ethnic and economic diversification.
Q4) Who are the key stakeholders for this issue? (This step is important. You need to know the audience for your analysis to help decide how to present your results.)
The local Universities Social Science Department. Actually the whole community can be effected by decisions made using this teams decision support data and analysis.
Q5) Investigate the metadata and complete this table:
| Layer | Data Type | Publication Information: Who Created the Data? | Time Period Data is Relevant | Spatial Horizontal Coordinate System | Attribut Values |
| chicago | Vector | Tele Atlas ESRI | 2006 | GCS_WGS 1984 | City, class features |
| county | Vector | Tele Atlas ESRI | 2000 | GCS_WGS 1984 | County, class features |
| tracts_00 |
Vector | Tele Atlas ESRI | 2006 | GCS_WGS 1984 | Census data polygons |
| tracts_90 | Vector | ESRI Data & Maps 1999 | 1990 | Geographic | Census data polygons |
Q6) What information in tracts_00 and tracts_90 can be used to show possible residential patterns of African-Americans, Hispanics, and Caucasians?
Black, White, and Hispanic population values related to that particular geographical area. How those values have changed in the ten year period.
Q7) Is there information in tracts_00 that can be used to display median house value?
No. That will be imported later from Factfinders.com.
Q8) Describe the spatial distribution of population in Cook County.
Q9) Why should you normalize the data?
Normalizing data using ArcView's Legend Editor is a quick way to design ratio maps. Census data for a range of geographic areas (tracts, counties, states) provides a rich source of these mapping opportunities. This document is a guide to the concept of normalizing with ArcView using census data for examples. It offers background on some key data concepts, possible pitfalls, and suggestions on many "normalizing data pairs." GIS: Normalizing Census Data in ArcView
Q10) How does the normalized data differ from the original data?
Non-Normalized
Normalized
Q11) Describe the distribution of the African-American population and how it has changed between 1990 and 2000.
Q12) Describe the distribution of the Hispanic population and how it has changed between 1990 and 2000.
Q13) Describe the distribution of the Caucasian population and how it has changed between 1990 and 2000.
Q14) Where are there clusters of high and low diversity?
The map below show many different areas of high and low ethnic diverse areas. But there does not seem to be very much clustering.
Q15) What does low diversity mean?
Not a mix of a lot of different ethnicities.
Q16) Where are there clusters of high and low diversity?
In 1990 there seems to greater diversity towards the downtown urban area of the city of Chicago. In 2000 the diversity is spread more evenly.
Q17) Describe how the diversity index has changed from 1990 to 2000.
1990
2000
Q18) Closely investigate Cook County by zooming in. What do you observe about the diversity of the census tracts?
As I zoom in I notice that the census tracts begin to looked clustered.
Q19) What does looking at the data in 3D reveal?
This is a testQ20) What does the median value represent?
This represents the median or average value of the homes. Total value of homes divided by the number of homes.
Q21) What is the lowest median_val?
$9999 (see illustration below)
Q22) What is the highest median_val?
$38,284,771
Q23) Describe the spatial distribution of house values in Cook County.
This is a test.Q24) What does Count on y-axis represent?
Number of homes.
Q25) What does the median_val on the x-axis represent?
Median value of homes.
Q26) Explain the patterns you see.
Dark blue expensive homes with little ethnic diversity. This is highly contrasted by the raised red portions in southern Cook county, which reflect greater diversity and lower home values.
Q27) Explain the double variable map.
As the legend reveals the color areas are the home values. The raised areas (raised by 3D) represent diversity. The high areas representing greater diversity.
Q28) Describe the relationship between median house value and the concentrations of different ethnic/racial groups.
This is the same map as 2000 above. I'm
including it
because it was on
one of many alternative attempts I made. This particular module was
very difficult for the program to handle as it crashed and posed
various technical problems. This adversity was painful, but
educational.
FYI: I did all modules at least three times, but this module set the record at eight times. It seems by it nature that GIS calls for careful and accurate organizational skills. I believe because of their design principals it is taken even further when your trying to redo projects in the ESRI products. Maybe it is frustration or naiveness but I believe ESRI products are poorly designed and poorly programed.